
1. Test 3
(✅ 표시는 틀린 문제...🥴)
1. Creating a scatter plot requires a minimum of how many measures? → 2
Scatter plot을 만들 때 최소 2개의 measure(측정값)이 필요하다.
2. Which one of the following is a dimension? → Measure Names
- Dimension : Measure Names
- Measure : Number of records, Longitude, Latitude
3. Which of the following options best describe measures?
→ They are numeric, quantitavtive
Measure : numerical, quantitative
4. ✅ Which of the following are true about Dashboards in Tableau?
✔ 대시보드
- Floating items can be layered over other objects
- A bar chart can be used a floating item
- Tiled items don’t overlap
5. ✅ Suppose you have a bar chart. When we group by labels in a view, which of the following happens?
✔ bar 차트에서 label로 그룹화할 때
→ A new mark (bar) is created, which consolidates all members of the group
(새로운 마크(바)가 생기며 그룹의 모든 멤버들이 통합된다)
6. Which of the following is a compelling reason to export a sheet in Tableau to a PDF?
태블로의 시트를 PDF로 내보내기(export)하는 이유?
→ If we want a static view of the visualisation
(고정된 뷰로 보기 위해)
7. Which of the following sets would you use to compare the members? → Combined Sets
멤버들을 비교하기 위해 사용되는 집합 : Combined Sets (결합된 집합)
8. Which of the following can help us focus on specific data without removing data in the visualization?
시각화에서 데이터 제거 없이 특정 데이터에 집중할 수 있도록 하는 기능 : Highlighters (하이라이트 기능)
9. ✅ When is an axis created for the visualisation in Tableau?
✔ 축 만들기
→ When we drag a continuous field to the row/column shelf
(연속된 필드를 행/열에 드래그)
10. Which of the following can you add a reference line to?
추세선 (reference line)은 Calculated Fields 와 Measures에 추가할 수 있다.
11. ✅ When field names in the Union do not match, then:
✔ Union에서 필드명이 매치되지 않으면
→ Both field names are present in the Union, but contain several null values
(모든 필드명은 나타나지만 values에 null이 포함된다)
12. ✅ Beginning in version 10.5, when you create a new extract, it uses the .hyper format instead of the .tde format.
→ 10.5 버전부터 새로운 추출을 만들 때, .tde 포맷 대신 .hyper 포맷을 사용한다.
13. ✅ When there are both negative and positive values for a field, the default range of values will use two color ranges. This is known as a diverging palette.
negative와 positive values가 필드에 있을 때, values의 기본 범위는 2개의 컬러 범위로 사용되는데, 이것은 diverging palette이다.
14. ✅ Which of the following describes the best way to change the formatting at a workbook level?
✔ workbook level (통합 문서)에서 서식을 변경하는 방법
- 위에 있는 메뉴에서 서식 (format) 선택 → workbook pane의 새로운 서식에서 서식 설정
15. A union of two tables usually results in an increase in the number of rows
2개의 테이블을 유니온하면 행의 수가 증가한다.
16. ✅ Which of the following are true about dimensions?
✔ Dimension
- They contain qualitative values (such as names, dates, or geographical data)
- Dates are mostly placed in dimensions by default for relational data sources
- They affect the level of detail in the view
17. Which of the following are valid reasons to use a Tableau Data Extract (.tde) over Live Connections?
✔ Live Connections로 .tde를 사용하는 이유
- Help improve performance
- Fast to create
- To support additional functionality such as count distinct
18. ✅ While borders and background colors let you visually highlight items on a dashboard, padding lets you precisely space items.
→ 테두리 및 배경색을 사용하면 대시보드의 항목을 시각적으로 강조 표시할 수 있지만 패딩(여백)을 사용하면 항목의 공간을 정확하게 지정할 수 있습니다.

- padding (여백)을 사용하면 대시보드에서 항목의 공간을 정확하게 지정할 수 있음
- 테두리와 배경색을 사용하면 항목을 시각적으로 강조 표시할 수 있음
- 내부 여백 : 항목 내용과 테두리 및 배경색의 둘레 사이의 간격을 설정함
- 외부 여백 : 테두리 및 배경색 이외의 추가 간격을 제공함
19. Is it possible to make a Measure discrete? → Yes
Measure은 discrete로 만들 수 있다.
20. ✅ Physical tables remain distinct (normalized), not merged in the data source whereas logical tables are merged into a single, flat table. (X)
✔ 논리적 테이블(logical table)은 데이터 원본에서 merge되지 않고 별개의 상태로 유지됨
→ 논리적 테이블 : Relationship
Relationship은 결합은 되지만 기존에 있는 데이터는 유지됨
- 물리적 테이블(Physical table)은 단일 테이블로 merge됨
→ 물리적 테이블 : Join
Join은 결합하면서 기존에 있는 데이터가 제거됨
| Logical Layer | Physical Layer |
| Relationships canvas in the Data Source page | Join/Union canvas in the Data Source page |
| Tables that you drag here are called logical tables | Tables that you drag here are called physical tables |
| Logical tables can be related to other logical tables | Physical tables can be joined or unioned to other physical tables |
| Logical tables are like containers for physical tables | Double-click a logical table to see its physical tables |
| Level of detail is at the row level of the logical table | Level of detail is at the row level of merged physical tables |
| Logical tables remain distinct (normalized), not merged in the data source | Physical tables are merged into a single, flat table that defines the logical table |

21. If you have a dashboard and are displaying its filter, how can you rearrange it?
→ By clicking on the 2 lines on top and dragging the filter.
✔ 대시보드에서 필터를 나타낼 때 재배열하는 방법
→ 위에 있는 2개의 줄을 클릭하고 필터에 드래그한다.
22. ✅ What is a story point in Tableau?
✔ story point : a single worksheet or dashboard (스토리 내의 요소들)
23. ✅ Which of the following are valid way(s) to make either of Rows or Columns Bold without affecting the other?
✔ 다른 것에 영향을 주지 않고 열과 행에 Bold처리 하는 방법
- 메뉴 바에서 서식 (format) 선택 → Row or Column 선택 → header 옵션에서 Bold 선택
- Rows or Columns 우클릭 → 서식 선택 → 폰트 옵션에서 Bold 선택
24. If you see a Blue field, generally it will add headers to the view.
25. ✅ Suppose you create a bar chart by dragging a dimension to the Column shelf and a measure to the Rows shelf. Which of the following would create a stacked bar chart?
하나의 Dimension을 열에, 하나의 Measure를 행 선반에 드래그하여 bar 차트를 만들었을 때, 중첩 bar 차트를 만드는 방법
→ By dragging another dimension to Color on the Marks card
26. Which of the following are benefits of combining sheets using dashboards?
✔ 대시보드에 사용한 시트를 합칠 때의 이점
- Easier to compare visualisations side by side
- Helps in faster analysis
- Provides the ability to use one sheet as a filter for other
27. ✅ Which of the following are valid Layout Container types when using Dashboards in Tableau?
✔ 대시보드에서 Layout Container의 유형
- Horizontal Container
- Vertical Container
28. ✅ Which of the following are valid Dashboard size options?
✔ 대시보드 사이즈 옵션
- Automatic
- Range
- Fixed Size
29. In which of the following scenarios would having a live connection be more beneficial than using an extract?
✔ extract 보다 live connection이 더 이점인 상황
- Analyzing real time data from production systems
- Analyzing and tracking real time flight updates
- Analyzing real time stock prices
30. Which of the following calculations DO NOT need a quick table calculation?
✔ quick table calculation
- Running Total (총계)
- Differnect (차이)
- Percent Differenct (비율)
- Percent of Total (총계 비율)
- Rank (순위)
- Percentile (백분위수)
- Moving Average (이동평균)
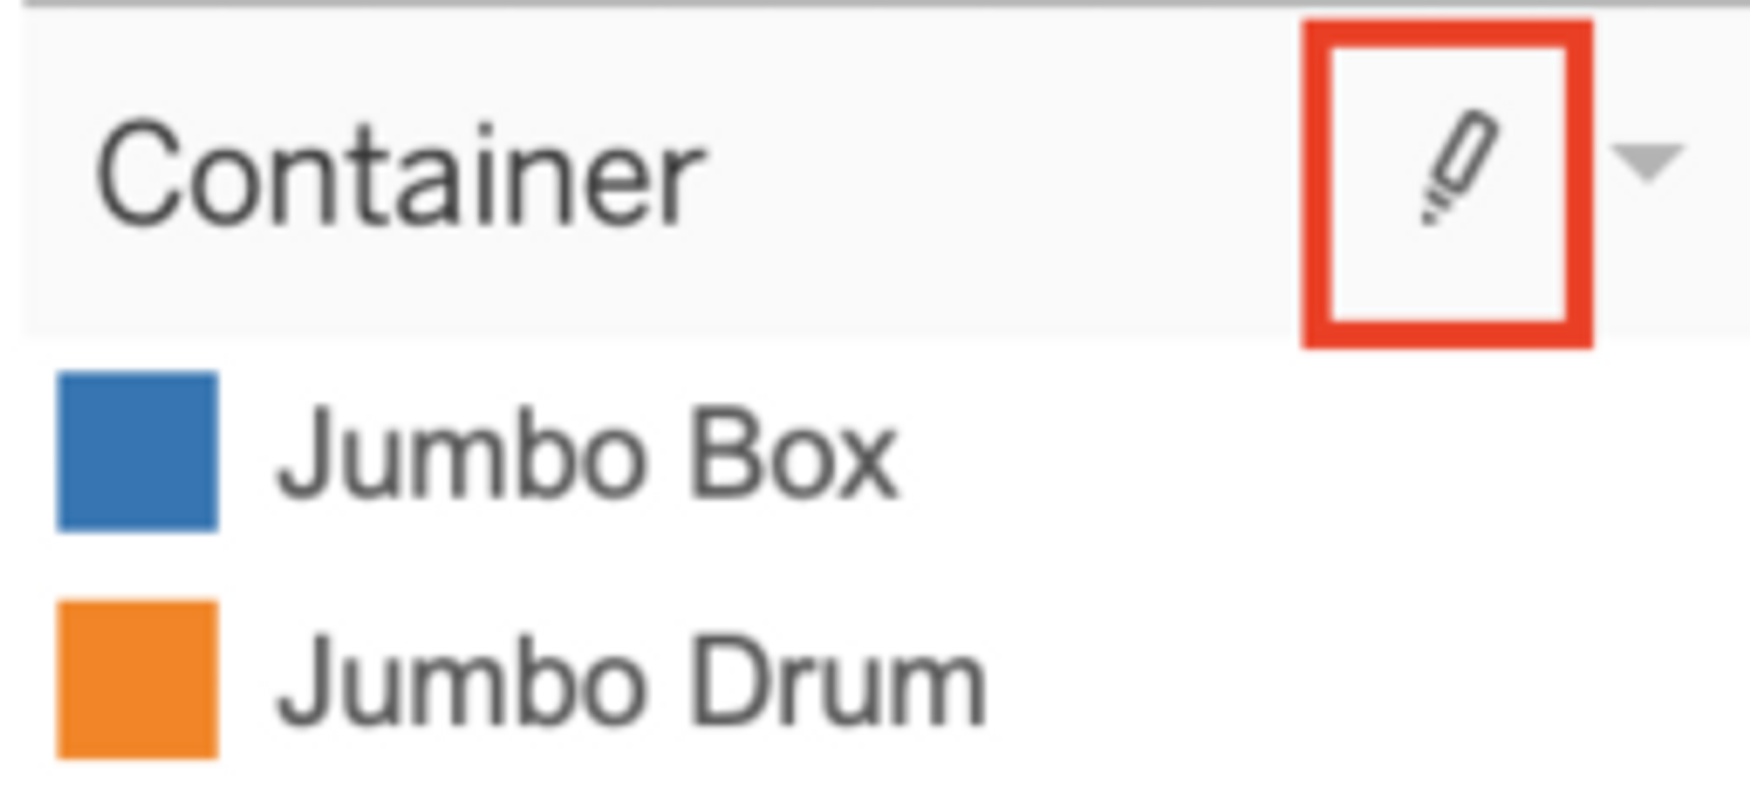
31. What does the following marker/icon do in Tableau?
→ Toggle the highlighting on/off
32. Which of the following are valid ways to italicize Tooltip content in Tableau?
✔ Tooltip (도구설명)에서 italicize 설정하는 방법
- 메뉴바에서 서식 클릭 → 폰트 선택 → 옵션 사용
- 메뉴바에서 워크시트 클릭 → 툴팁 선택 → 옵션 사용
- 마크 카드에서 툴팁 클릭 → 텍스트 선택 → 옵션 사용
33. ✅ Are animations enabled by default in Tableau? → NO!!!
애니메이션 기능은 태블로에서 절대 디폴트가 될 수 없음
→ 포맷 > 애니메이션 켜야 함
34. ✅ If you are working with a huge dataset, which of the following are strong reasons to use a context filter?
✔ context filter를 사용하는 이유
- Improve query performance
- To include only the data of interest
35. For which of the following charts, does the Size option on the Marks card not work?
→ Tree Map
마크 카드에서 Size 옵션이 불가한 차트 → Tree Map
36. How can you add color to marks in the view in Tableau?
✔ 마크 카드에서 색상 추가하는 방법
→ From the Data pane, drag a field to Color on the Marks card
37. Which of the following lets you group related dashboard items together so you can quickly position them?
→ Layout Container
관련된 대시보드 아이템을 함께 그룹할 수 있는 것 → Layout Container
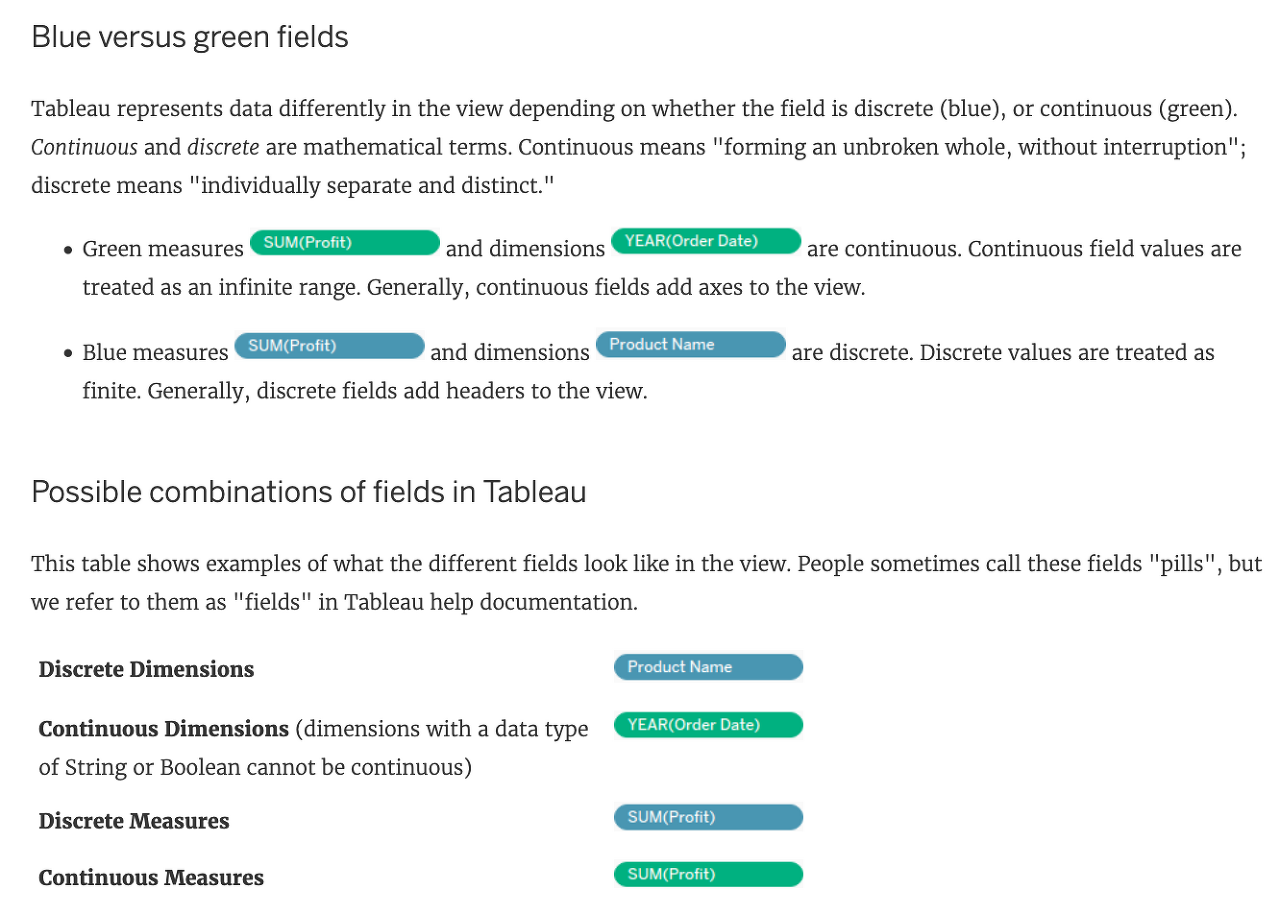
38. ✅ What do the colours Blue and Green represent in Tableau?
→ Blue : Discrete (불연속형) / Green : Continuous (연속형)
39. ✅ A Tableau Data Source File (.tds) contains which of the following?
✔ Tableau Data Source File (.tds)
- Default Field Properties
- Data Source Type
- Calculated Fields
+) 데이터 원본만을 보관해야 하는 파일
40. Which of the following is a benefit of using a Tableau Data Source (.tds)?
✔ Tableau Data Source File (.tds)의 이점
- 실제 데이터는 포함되어 있지 않으며, Default Field Properties를 변경하고 Calculated Fields를 만드는 등과 같은 실제 데이터를 다루는 수정 뿐만 아니라 실제 데이터와 연결이 필요한 정보는 포함되어 있다.
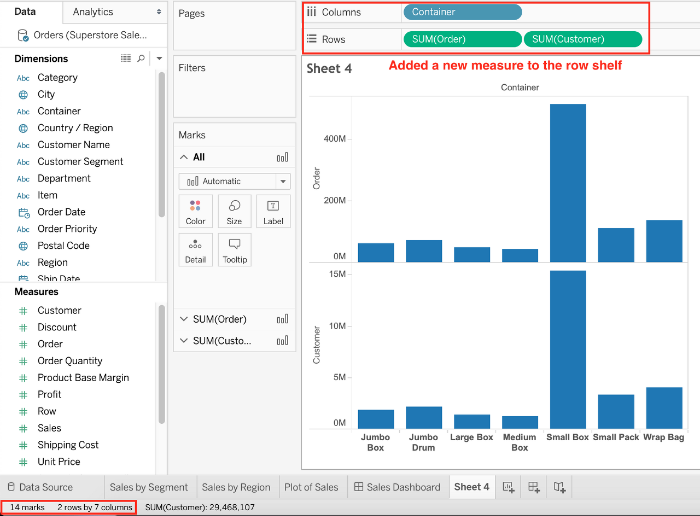
41. Suppose I have the following view. What will be the total number of marks if I drag a new measure to the row shelf vs the column shelf?
→ 열 : dimension 1개 / 행 : measure 1개가 있을 때, 열/행 선반에 하나의 새로운 measure을 추가하면 어떻게 될까?
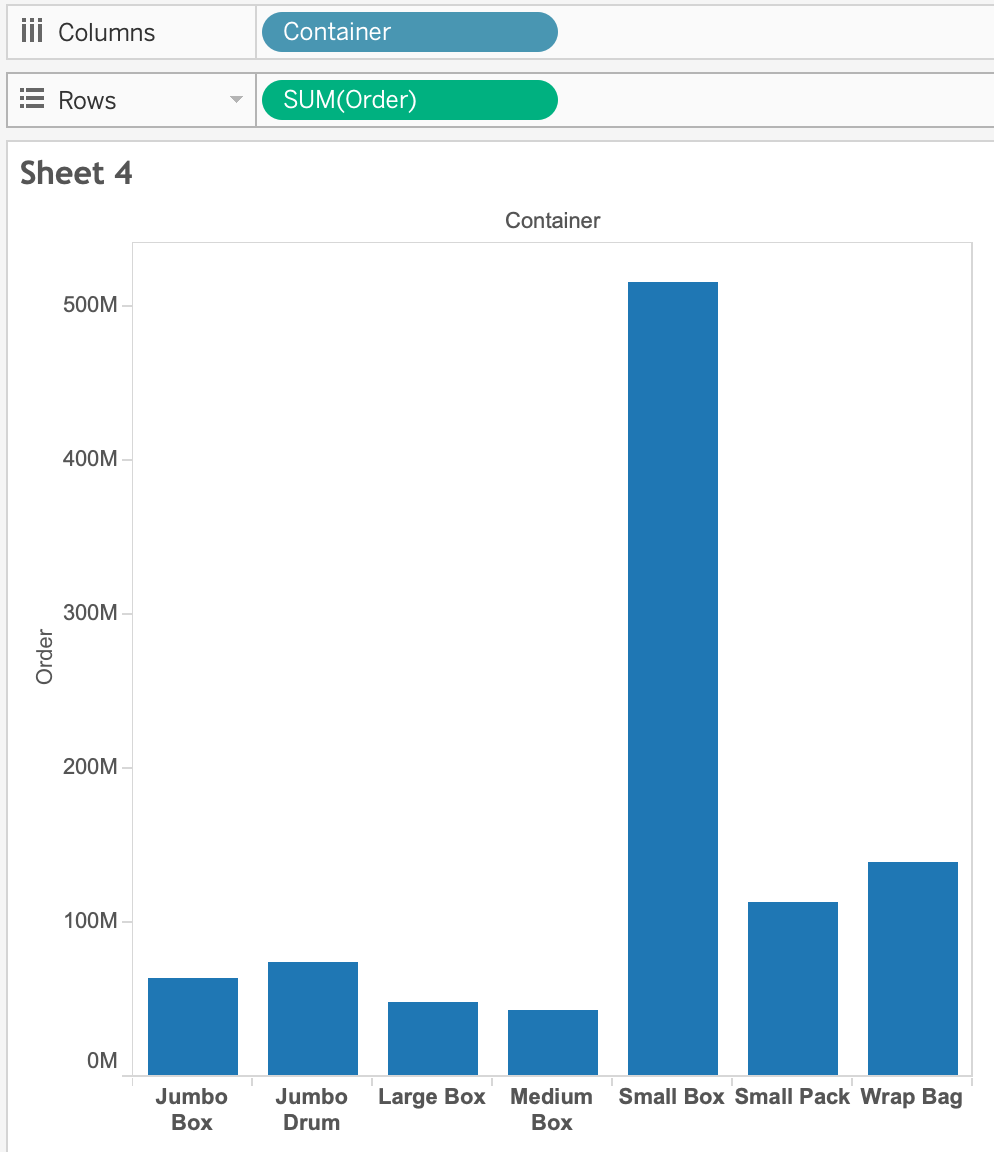
- measure이 있는 선반에 새로운 measure 추가
→ dimension의 header 갯수 x measure 갯수 (예시 이미지 : 7*2)
- dimension이 있는 선반에 새로운 measure 추가
→ dimension의 header 갯수

42. ✅ Which of the following are valid ways to Bold the Tooltip content in Tableau?
✔ Tooltip에서 Bold 처리하는 방법
- Click on Worksheet in the Menu bar, followed by Tooltip and select the bold option
- Right click, click format and then under the default worksheet formatting, choose Tooltip and make it bold
- Click on Tooltip in the Marks card, and select bold
43. ✅ How can you format an axis as Bold in Tableau?
✔ 축을 Bold 처리하기
→ 축 우클릭 > 서식 클릭 > 볼드 옵션 설정
44. ✅ Which of the following are valid ways to export a dashboard with multiple visualisations as an image?
대시보드의 여러개 시각화를 이미지로 내보내기하는 방법
→ Click on Dashboard in the Menu bar followed by Copy Image
45. Which of the following are valid ways to make the font more readable in Tableau?
✔ 잘 읽히는 폰트를 만드는 방법 (애매한 문제..)
- Use a clear and readable font
- Make the Font color sharper, darker than the background
- Increase the font size
💡 회고
오늘부터 본격적인 태블로 자격증 시험 공부 시작!
오늘 푼 문제는... 반타작했다 ㅎ
생각보다 헷갈리는 문제들이 많았고,, 무엇보다 영어로 되어있어서 해석하는 것에 오래걸렸다. (간혹 해석이 잘 되지 않아.. 틀린 것도 있움...!)
그래도 오늘처럼 문제를 하나씩 꼼꼼하게 해석하고 태블로에서 직접 구현하며 이해를 하니 확실히 머릿속에 들어온다!
이번주 주말에 시험을 보는 것이 나의 첫번째 목표, 그리고 합격하는 것이 두번째 목표인데...
이 모든 목표를 모두 달성할 수 있도록 꼼꼼히 공부하기😎💪
'웅진X유데미 STARTERS > TIL (Today I Learned)' 카테고리의 다른 글
| [스타터스 TIL] 44일차.태블로 실전 트레이닝 (20) - 태블로 자격증 공부 (Test 1, Test 2) (1) | 2023.04.08 |
|---|---|
| [스타터스 TIL] 43일차.태블로 실전 트레이닝 (19) - 태블로 자격증 공부 (Test 4, Test 5) (0) | 2023.04.07 |
| [스타터스 TIL] 41일차.태블로 실전 트레이닝 (17) - 팀 프로젝트 발표, 태블로 자격증 공부 (0) | 2023.04.04 |
| [스타터스 TIL] 40일차.태블로 실전 트레이닝 (16) - 팀 프로젝트 (1) | 2023.04.04 |
| [스타터스 TIL] 39일차.태블로 실전 트레이닝 (15) - 팀 프로젝트 (0) | 2023.04.01 |