
1. Test 1
1. In order to avoid any confusions, what should you do after creating a Dual-axis chart?
→ Synchronise the axis
혼란을 피하기 위해 이중 축을 만든 후에는 반드시 '축 동기화'를 해주어야 한다.
2. Data granularity refers to the level of detail for a piece of data, wherever you are looking.
데이터 세분성은 데이터에 대한 세부 수준을 나타낸다.
3. You have cleaned a data source properly, created some calculated fields and renamed some columns. You want to save these changes for future use cases. Which of the following would BEST satisfy this requirement?
→ Save it as a .tds file
아래의 변경 사항을 저장하기 위해서는 .tds 파일로 저장을 해야 한다.
- 데이터 원본 정리
- 계산된 필드 생성
- 열 이름 변경
4. Dimensions containing String and Boolean values cannot be continuous.
차원(dimension) 중 String과 Boolean은 연속형으로 변환될 수 없다.
5. When you want to first apply a filter and THEN show the Top N or Bottom N elements, which of the following filters would you use?
→ Context Filter
컨텍스트 필터는 이를 적용하여 상위 n, 또는 하위 n 요소를 표시하려고 할 때 사용한다.
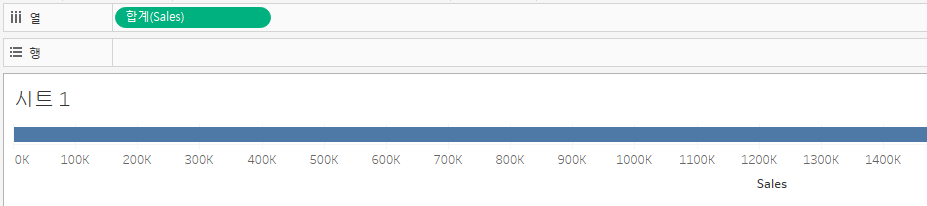
6. You clicked Sheet 1 from the data source page, and now you have opened the Tableau Desktop workspace as shown above. What is the main thing that you do here?
→ Create visualisations to analyze your data
하단의 시트 1을 클릭한 후 데이터를 분석하기 위해 시각화할 수 있다.
7. Trend lines can only be used with numeric or date fields.
추세선은 numeric , date 필드에서만 사용할 수 있다.
8. Relationships are represented by noodles and operate at the logical layer.
관계는 Noodle로서 표현되며, 논리 계층(Logical Table)에서 작동한다.

9. All rows from both tables are returned in an INNER JOIN (X)
INNER JOIN은 2개의 테이블에서 공통된 rows만 출력된다.
10. Which of the following shapes does a Heat Map use by default? → Square

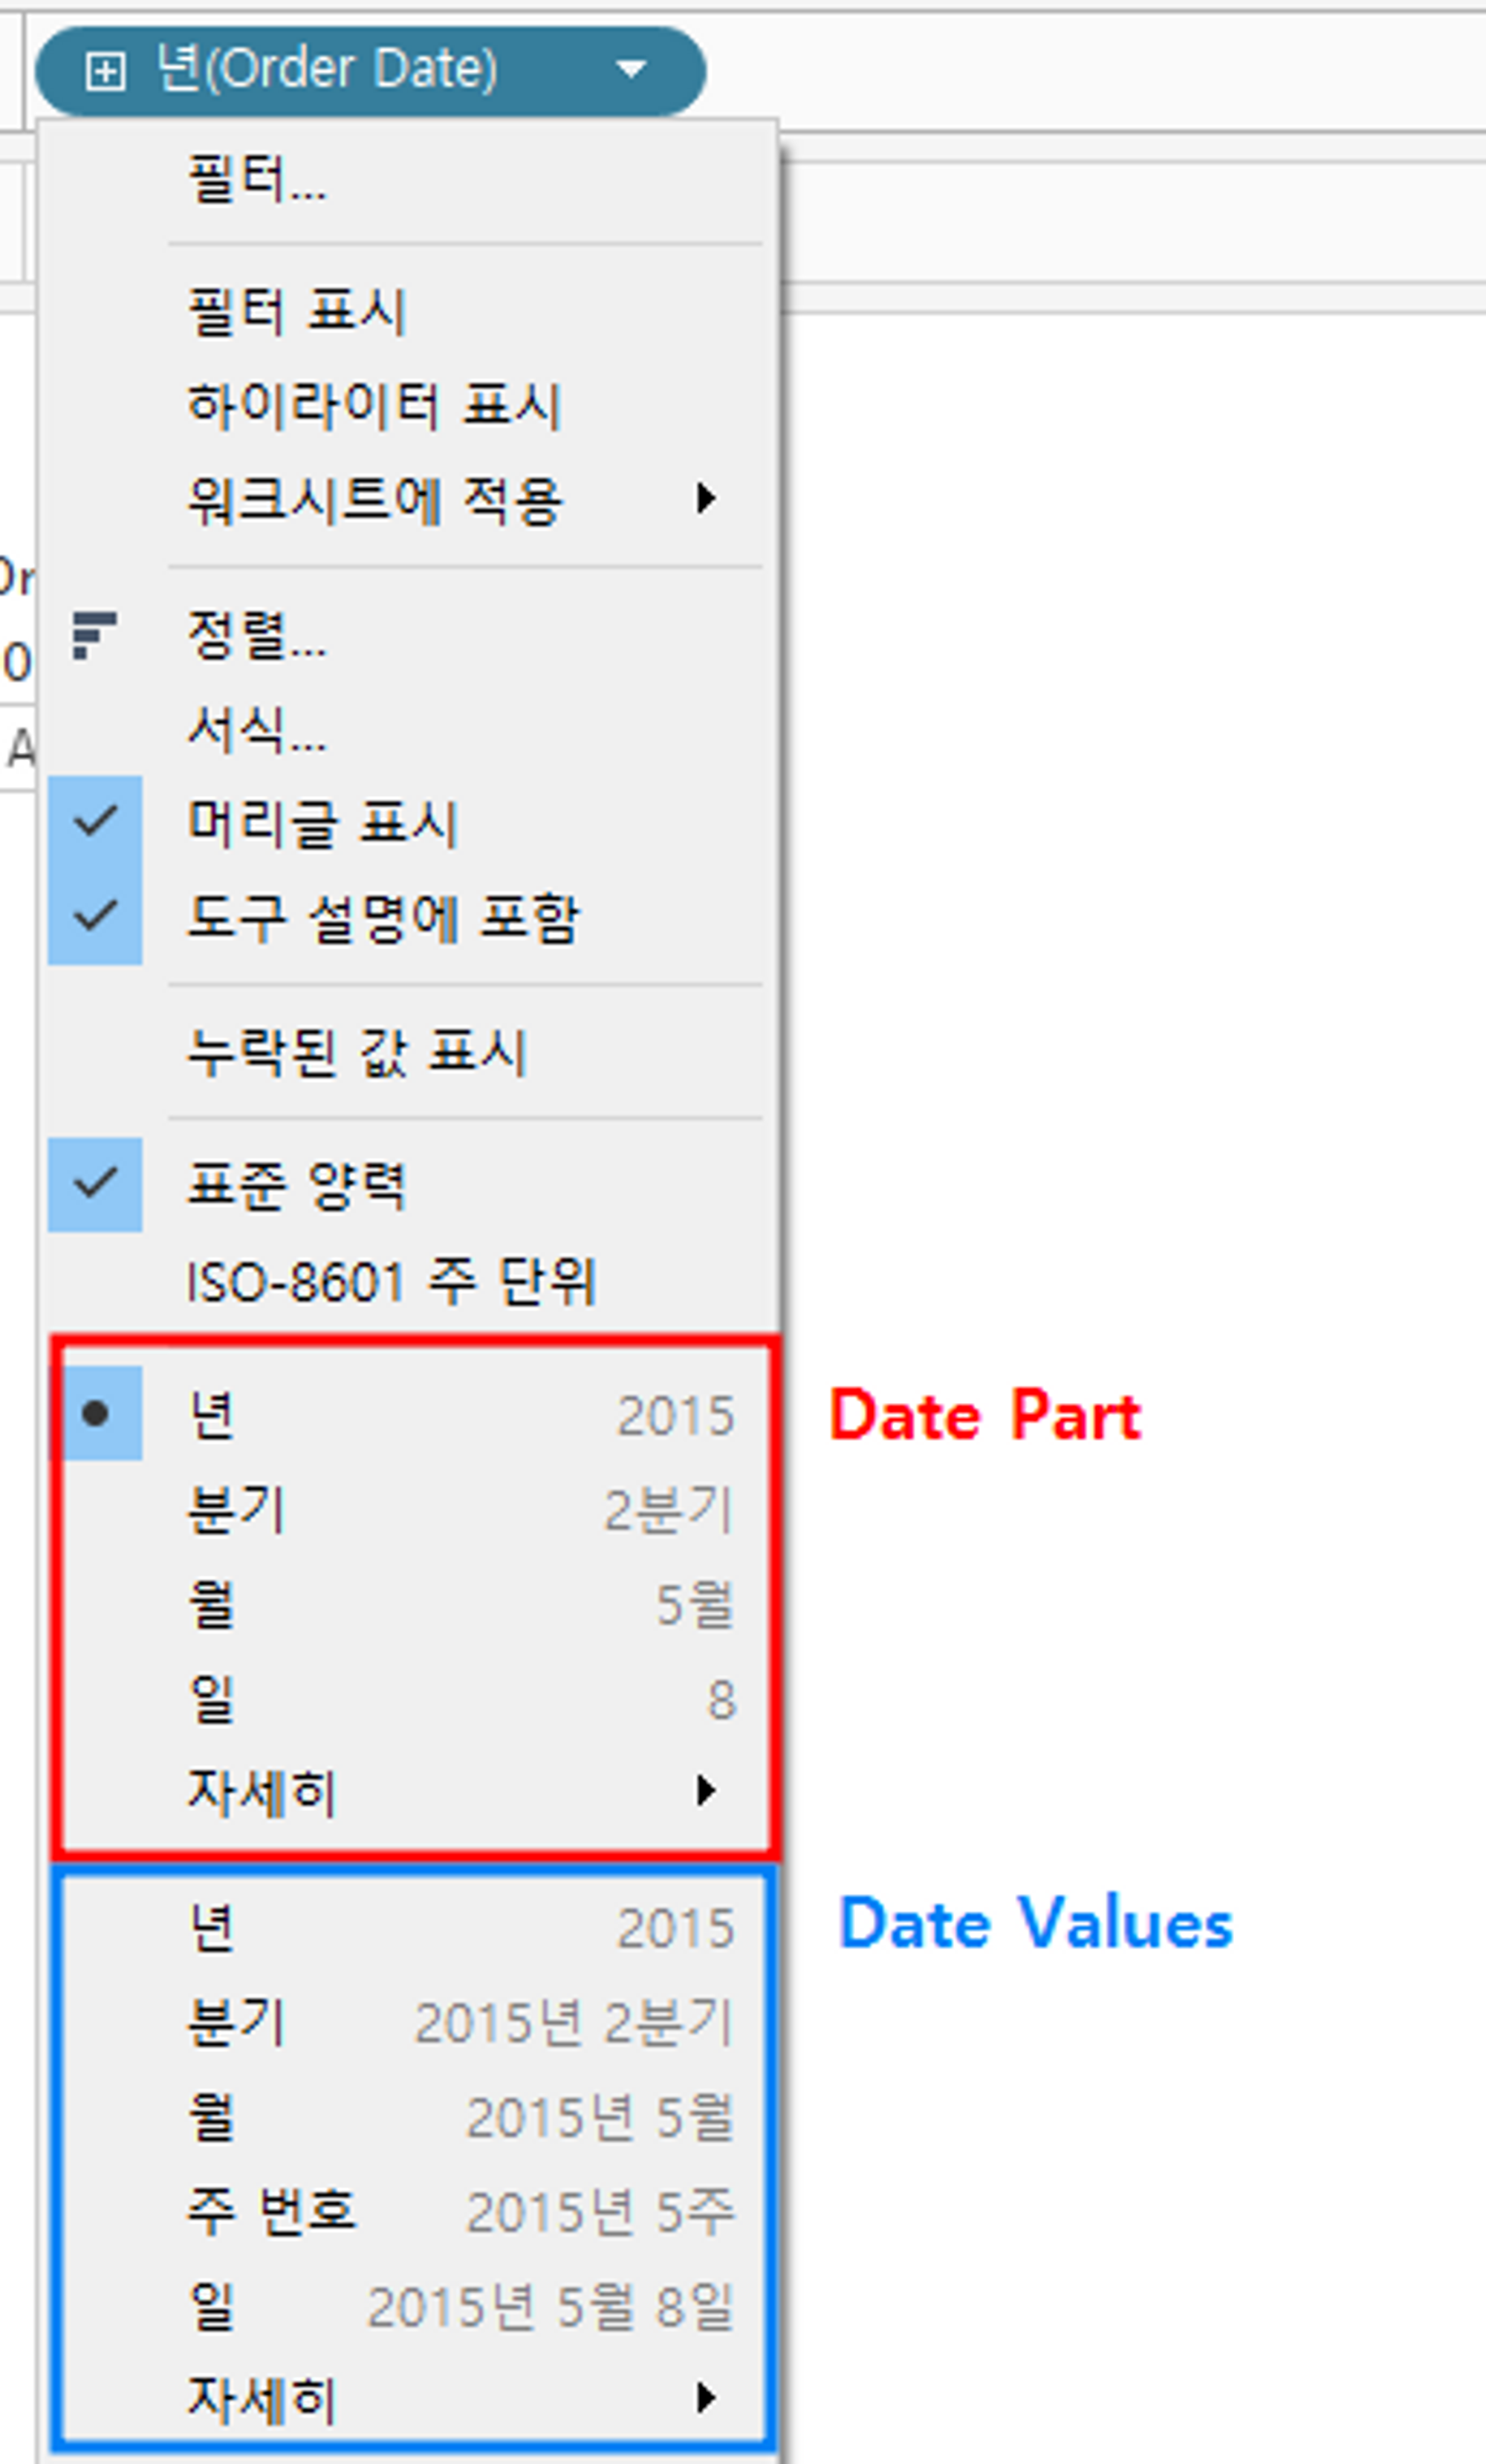
11. Which of the following is an example of a Date Part? → November
12. Most viewers scan content starting at the top left of a page.
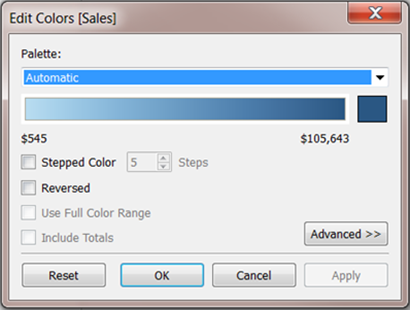
13. We get different colour pallete options if we drop a discrete field on "Color" in the marks card compared to if we drop a continous field on Color.
- discrete field

- continuous field

14. The Highlighting action can be disabled for the entire workbook.
하이라이트 action은 전체 workbook (통합문서)에 대해 비활성화할 수 있다.
15. Which of the following is true about 'Incremental refresh' when creating Extracts in Tableau?
→ It only adds rows that are new since the previous refresh.
추출할 때 점진적 새로고침(incremental refresh)은 새로운 열을 추가함으로써 가능하다
16. You just added this field to the Columns shelf. What will this create?
→ A horizontal axis (수평 축)

✔ A horizontal axis (수평 축)
✔ A vertical axis (수평 축)

17. Which of the following represent a valid method to create a Bullet Graph with the LEAST number of fields possible?
→ Using 2 measures
불렛 그래프는 적어도 2개 이상의 measure이 필요하다.
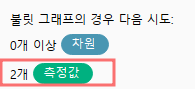
18. For Bullet Graphs we need at least 2 measures
19. Tableau Server enables us to create workbooks and views, dashboards, and data sources in Tableau Desktop, and then publish this content to our own server.
Tableau Server를 사용하면 Tableau Desktop에서 workbook, view, dashboard, data source를 생성한 다음 해당 콘텐츠를 자체 서버에 게시할 수 있다.
또한 Tableau Server 관리자는 서버 컨텐츠에 액세스할 수 있는 사용자를 제어할 수 있으며, 사용자 권한을 설정할 수 있다.
20. Which of the following chart type makes use of 'binned' data? → Histogram
21. As a general best practice, how many categories can a pie chart display effectively? → 2 ~ 5
파이차트는 2-5개 분류가 적당하다
22. Which of the following are compelling reasons to use a Stacked Bar Chart?
→ To be able to visualize complex information with fewer bars / marks
(더 적은 막대/마크로 복잡한 정보를 시각화할 수 있음)
→ To visualize parts of a whole
(전체의 부분을 시각화할 수 있음)

23. It is possible to blend axes for multiple measures into a single axis
여러 측정값을 하나의 축으로 혼합할 수 있다.
→ 조합된 축 차트(combined axis chart)나 혼합 축차트(blended axis chart)
24. Bins can be created on dimensions
통(bins)은 비단 측정값(measures)뿐만 아니라, 숫자로 표현된 차원(dimension)도 가능하다
25. We can join a maximum of 32 tables in Tableau
태블로에서 조인은 최대 32개까지 가능하다. 2의 5승
26. It is possible to add a field to more than one hierarchy
필드를 복제하여 둘 이상의 계층에 추가할 수 있다.
27. Which of the following are stored in a .tds file?
→ Data Connection information
→ Calculated Fields
→ Metadata edits
- .tds 파일은 데이터 원본에 연결하는 데 필요한 정보만 포함되며 실제 데이터 자체는 포함되지 않는다.
- 시각화가 저장되지 않는다.
- 사용자 모두가 권한이 있거나 데이터가 있어야 한다.
28. If you use a percent difference Quick Table Calculation, what value will be the first data value?
→ null

29. How would you calculate GDP per capita in Tableau?
→ SUM([GDP]) / SUM([Population])
30. Is it possible to add both a Dashboard and a Worksheet at the same time to a Story Point in Tableau? NO!!!!
스토리 포인트에는 단 하나의 대시보드 또는 워크시트를 삽입할 수 있다.
31. Our use case states that we need to create a set showing the Bottom 10 products by Profit in each Region. Which of the following filter types should you apply on Region?
→ Context filters
컨텍스트 필터의 장점은 Tableau의 작업 순서에 따라 집합 이전에 실행이 된다.
원래의 모든 필터는 independent (독립적인) 필터이나, 컨텍스트 필터가 추가되면 다른 필터들은 dependent 필터가 된다.
32. If you decide you want to see all of the marks in the view at the most detailed level of granularity, you can disaggregate the view.
세부적인 수준에서 데이터를 확인하고 싶을 때는 view를 세분화할 수 있다.

33. Which of the following would you use to connect to multiple tables in a single data source at once?
→ A join
-조인(Join)은 실제 테이블을 밴다이어그램 형태로 나타낸다.
-조인(Join)은 특정 조건에 따라 데이터를 결합하는 전통적인 방법이다. 물리적 계층에서만 수행할수 있다.
-조인(Join)은 항상 새로운 테이블(new table)을 만들어낸다.
-조인(Join)은 정적(static)이다.
-조인(Join)은 하나 이상의 데이터 원본을 필요로 한다.
-조인(Join)은 여러 데이터의 연결에 적용될 수 있다.
- 조인(Join)은 서로 다른 집계(aggregation)이나 세부수준(levels of detail)의 데이터를 결합하면 중복(duplication)될 수 있다.
34. By default, what does Tableau do when you connect to a data source?
→ Creates a live connection to the data
35. By default, measures placed in a view are aggregated. The type of aggregation applied depends on the context of the view
대부분 SUM으로 되긴 하지만 항상은 아니다!
36. When you drop a continuous field on Color, Tableau displays a quantitative legend with a continuous range of colors.
37. The default path for all supporting files, data sources, icons, logs etc is in Documents → My Tableau Repository
38. Tableau auto-generates 1 dimension(s) and 4 measure(s) for us
1 Dimension - Measure Names
4 Measures - Latitude, Longitude, Number of records, Measure Values
39. Which of the following can you use to create a Histogram? → 1 measure

40. Which of the following are benefits of using Data Extracts in Tableau?
→ Improved Performance
→ Ability to use the data offline
→ Faster to work with
① 빅데이터 지원 ② 빠른 수행이 가능 ③ 추가적 기능 지원(COUNTD) ④ 오프라인으로 이용 가능
41. By definition, Tableau displays measures over time as a Line
날짜, 시간은 라인차트가 default이다.
42. Is it possible to use measures in the same view multiple times
(e.g. SUM of the measure and AVG of the measure)? YES!!!!!

43. Is SUM a table calculation? No!!!!!!!!!
SUM은 집계 함수 (aggregate function)이다.
✔ quick table calculation
- Running Total (총계)
- Differnect (차이)
- Percent Differenct (비율)
- Percent of Total (총계 비율)
- Rank (순위)
- Percentile (백분위수)
- Moving Average (이동평균)
44. Which of the following are valid objects when creating a dashboard in Tableau?
→ Text
→ Extension
→ Image
→ Web Page
45. Which of the following fields would be best used as Dimensions?
→ Categories
→ Names
2. Test 2
(틀린 문제 & 헷갈리는 문제 위주로 진행)
14. Which of the following are valid ways of Grouping Data?
- Using Marks in the view
- From the Dimension Shelf
- Using Labels in the View
15. How can you format numbers in Tableau as currency?
→ Right-click a measure or axis in the view and select Format.
Then in the Format pane, click the Numbers drop-down menu.
18. You may create a context filter to:
- Improve performance
- Create a dependent numerical or top N filter
22. What is the one critical difference between normal calculated fields, and the calculated fields created after Data blending?
→ Fields used in Blends must first be aggregated
✔ 조인 vs 혼합
- 조인(Join)과 혼합(Blend)의 가장 큰 차이점은 집계가 수행되는 경우이다.
- 조인(Join)은 데이터를 조합하고 집계한다
- 혼합(Blending)은 데이터를 집계하고 조합한다.
28. Which of the following are valid ways to show Mark Labels in the visualisation?
- Drag the measure to the Text label in the Marks Card
- Click on Analysis in the Menu bar and choose Show Mark Labels
- Click on the Show mark labels icon in the Toolbar
(메뉴바에 있는 데이터(data)에는 마크 라벨에 대한 기능이 없음!)
29. .twbx files are a local copy of a subset or entire data set that you can use to share data with others, when you need to work offline, and improve performance.
✔ .twbx 파일
- 오프라인으로 작업해야 할 때
- 다른 사람과 데이터를 공유
- 성능 향상시키는 데에 사용할 수 있는 하위 집합
- 전체 데이터 세트의 로컬 복사본
31. Broadly speaking, when users connect to Tableau, the data fields in their data set are automatically assigned a type and a role.
사용자가 Tableau에 연결하면, 데이터셋의 데이터 필드에 Type과 Role이 자동으로 할당된다. (외우기!!!!!)
✔ Role
- Dimension
- Measure
✔ Type
- String
- Number
- Geographic
- Boolean
- Date
- Date and Time
32. Broadly speaking, after an importing a dataset in Tableau Desktop, all fields in it are broken down into Dimensions and Measures
Tableau Desktop에서 데이터셋을 가져온 후에는 해당 데이터 셋의 모든 필드가 Dimension과 Measure로 구분된다.
35. Which of the following are correct ways to define a join in Tableau version 2020.3 and above?
- Double-check a logical table to go to the Join/Union canvas in the physical layer and add joins or unions
- Right-click a logical table and click on open to go to the Join/Union canvas in the physical layer and add joins or unions

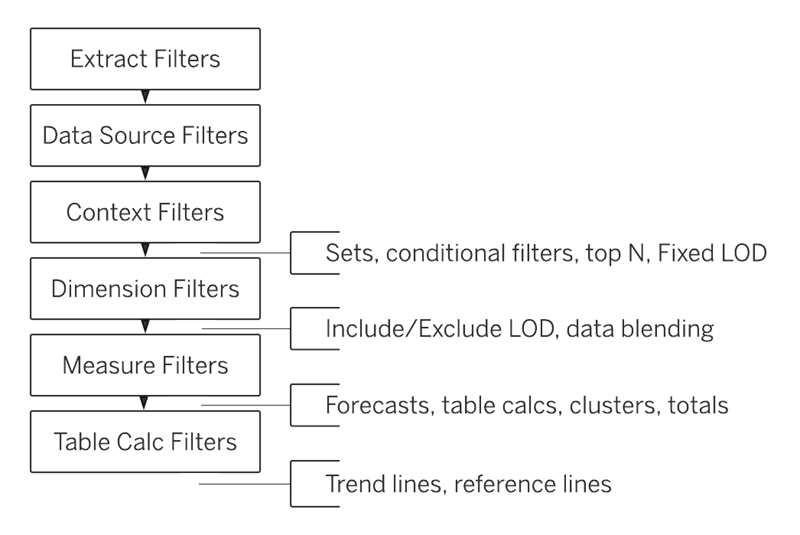
39. According to Tableau's 'Order of Operations', which of the following filters is applied FIRST?
→ Extract Filter

42. How does Tableau know at which level to aggregate values?
→ Values are always aggregated at the level of granularity of the worksheet.
Value는 항상 워크 시트의 세분화 수준에서 집계된다.
43. Which of the following URL prefixes are permitted when creating a URL Action in Tableau?
→ HTTP, HTTPS, FTP
(외우기!!!!)
45. Which of the following are valid ways to add Totals to a view?
- Using the Analytics Pane
- From the Analysis Tab in the Menu bar on top
💡 회고
마지막 태블로 오프라인 강의였다. 한 달이라는 시간이 길다고 생각했는데, 생각보다 빠르게 지나간 것 같아 놀랍다.
태블로 오프라인 강의에서 여러 프로젝트를 하면서 스스로 매우 많이 성장했다고 느낀다.
태블로의 기능만 알고 알음알음 알던 내가, 태블로의 다양한 기능을 구현하기도 하며, 시각화를 통해 여러 인사이트를 도출해내었다.
실무에서 어떻게 태블로가 사용되는지를 배울 수 있었으며, 아이디어 도출, 시각화, 인사이트 도출을 하는 프로젝트를 통해 많이 힘들었지만 정말 값진 경험이었다. 태블로 뿐만 아니라 여러 가지 방면으로 많이 성장한 한 달이었다.
그리고 이외에도 태블로 자격증이라는 것도 따두면 좋을 듯하여 열심히 공부를 하고 있다!
오래 준비는 하지 않았지만, 그래도 나름 열심히 준비했으니 좋은 결과가 있으면 좋겠다 :)
이번 주말에 태블로 자격증 시험을 신청했다! (첫 번째 목표 달성⭐)
두 번째 목표인, 자격증 합격도 달성하길 바라며 막바지 공부를 열심히 해봐야겠다💪
'웅진X유데미 STARTERS > TIL (Today I Learned)' 카테고리의 다른 글
| [스타터스 TIL] 46일차.SQL 실전 트레이닝 (2) - 컬럼 연산자, 날짜/시간형 데이터, 다중 행 함수 (0) | 2023.04.11 |
|---|---|
| [스타터스 TIL] 45일차.SQL 실전 트레이닝 (1) - 데이터 분석, 테이블파악 (0) | 2023.04.10 |
| [스타터스 TIL] 43일차.태블로 실전 트레이닝 (19) - 태블로 자격증 공부 (Test 4, Test 5) (0) | 2023.04.07 |
| [스타터스 TIL] 42일차.태블로 실전 트레이닝 (18) - 태블로 자격증 공부 (Test 3) (0) | 2023.04.05 |
| [스타터스 TIL] 41일차.태블로 실전 트레이닝 (17) - 팀 프로젝트 발표, 태블로 자격증 공부 (0) | 2023.04.04 |