1. Test 4
1. Which of the following is not a Trend Line Model?
✔ 태블로 추세선 종류
1. Linear Trend Line (선형)
2. Logarithmic Trend Line (로그)
3. Exponential Trend Line (지수)
4. Polynomial Trend Line (다항식)
5. Power Model (거듭제곱)
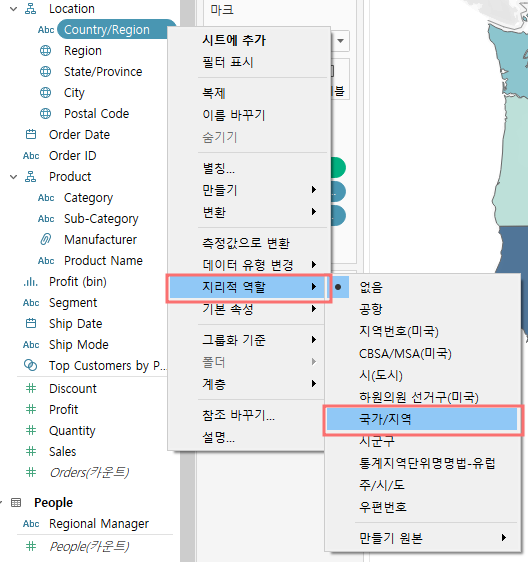
2. It is possible to change the Geographic Role of a dimension
- 차원의 지리적 역할로 변경이 가능하다.
- 지리적 역할은 필드의 각 값을 위도 및 경도 값과 연결한다.
3. Tableau can create worksheet-specific filters
- 워크시트에 필터를 추가한다면, 디폴트로 현재 워크시트에 적용이 된다.
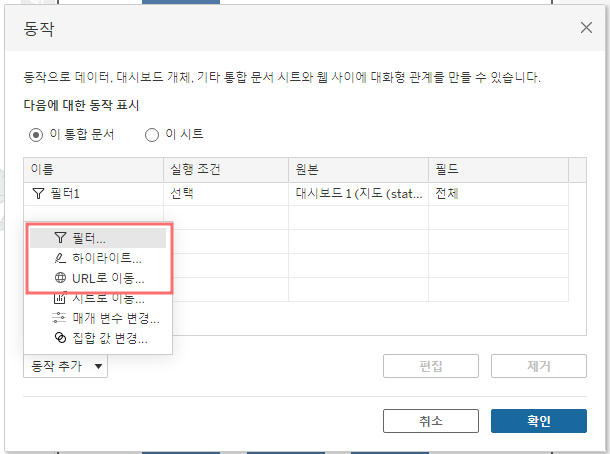
4. ✅ To customize links based on the data in your dashboard, you can automatically enter field values as parameters in URLs.
- field, parameter, filter 모두 가능함!
- 대시보드의 데이터를 기반으로 링크를 사용자 정의하려면 URL에 자동으로 필드 값을 매개변수로 입력할 수 있다.
- URL action은 웹 페이지, 파일, 다른 웹 기반 소스로 이동하는 하이퍼링크이다.

5. ✅ Sets can be created on dimensions.
- Sets는 데이터 소스로부터 dimensions를 기반으로 만들어지는 custom field다.
- dimension이나 measure는 조건부 논리 (conditional logic)를 사용하여 집합에 포함되거나 제외하는 항목을 결정하는 데에 사용될 수 있다.
- 하지만 Sets를 만들기 위해서는 dimension을 사용한다
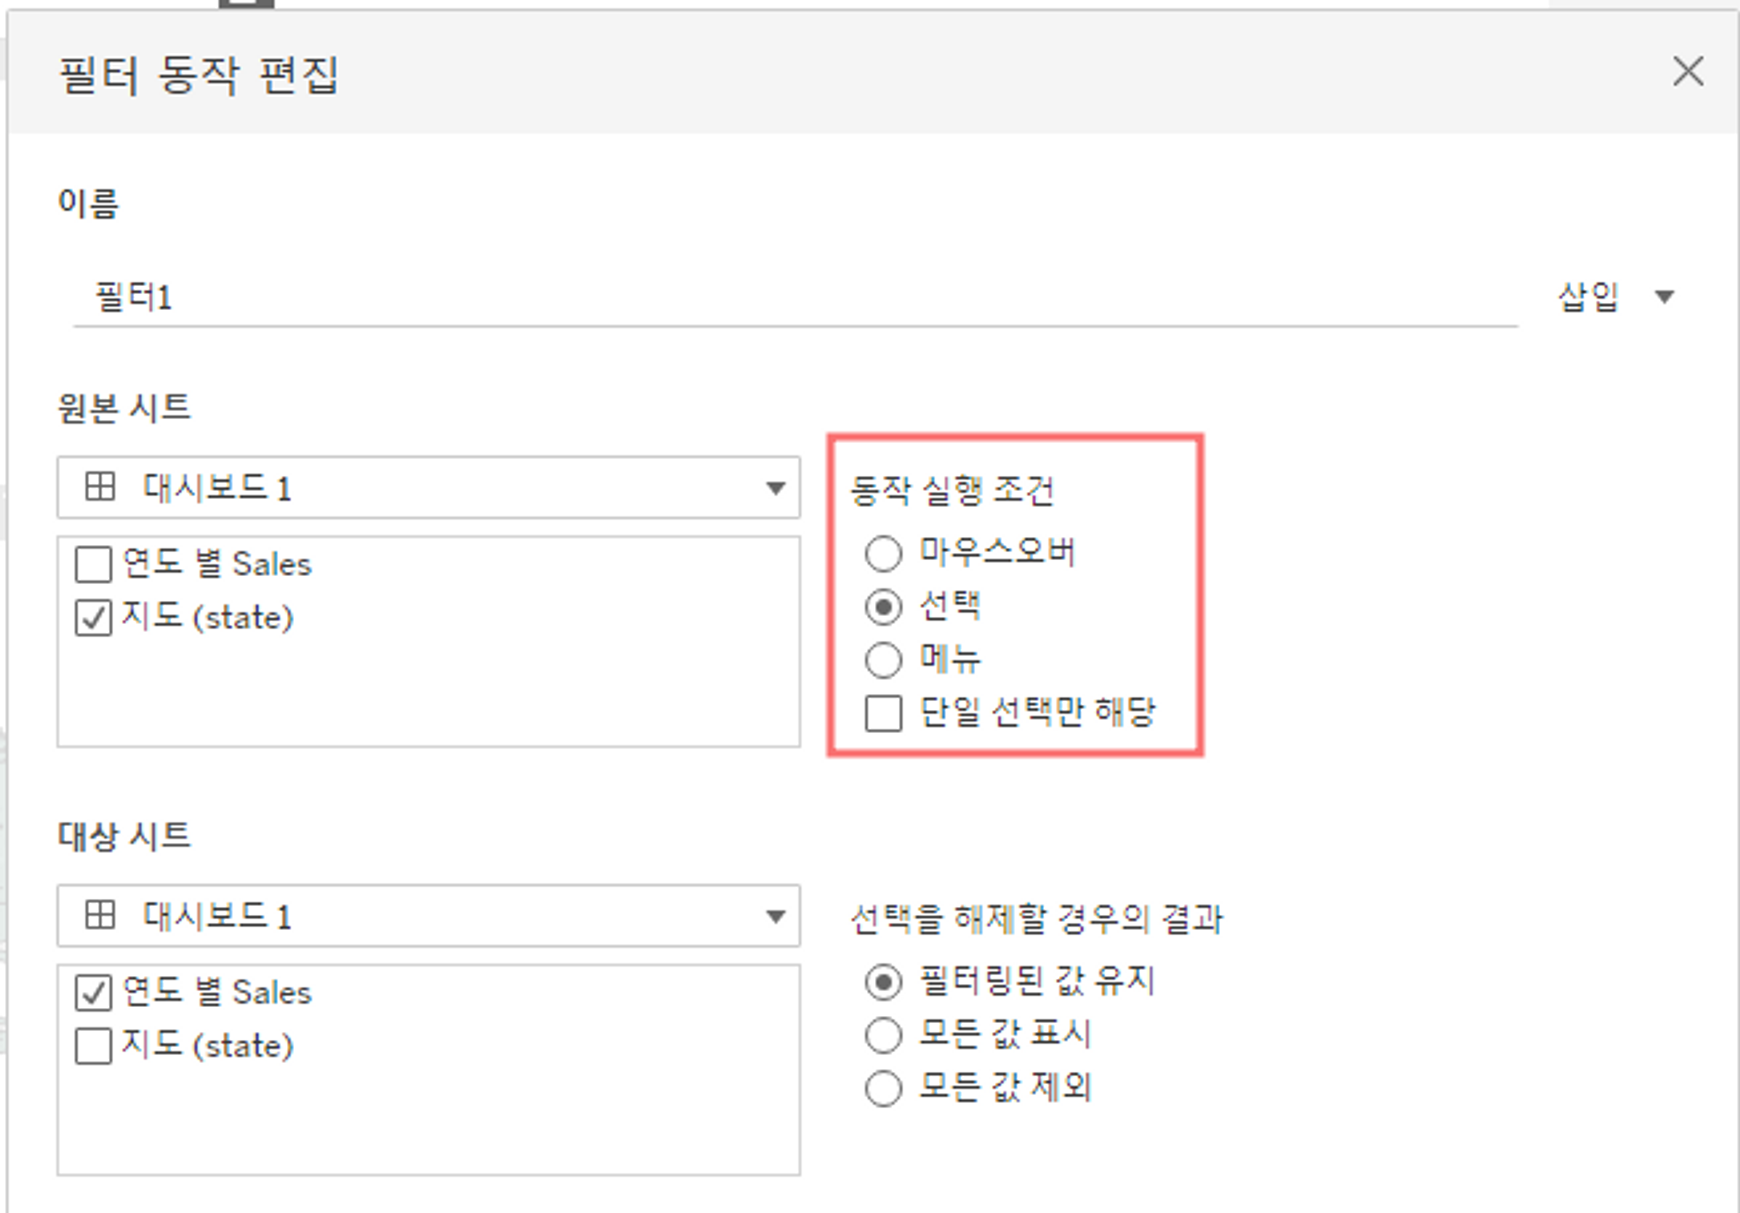
6. ✅ Which of the following are valid ways to trigger actions for a Dashboard?
- 대시보드에 action을 추가할 때, 사용할 수 있는 action
- Select (선택)
- Hover (마우스오버)
- Menu (메뉴)
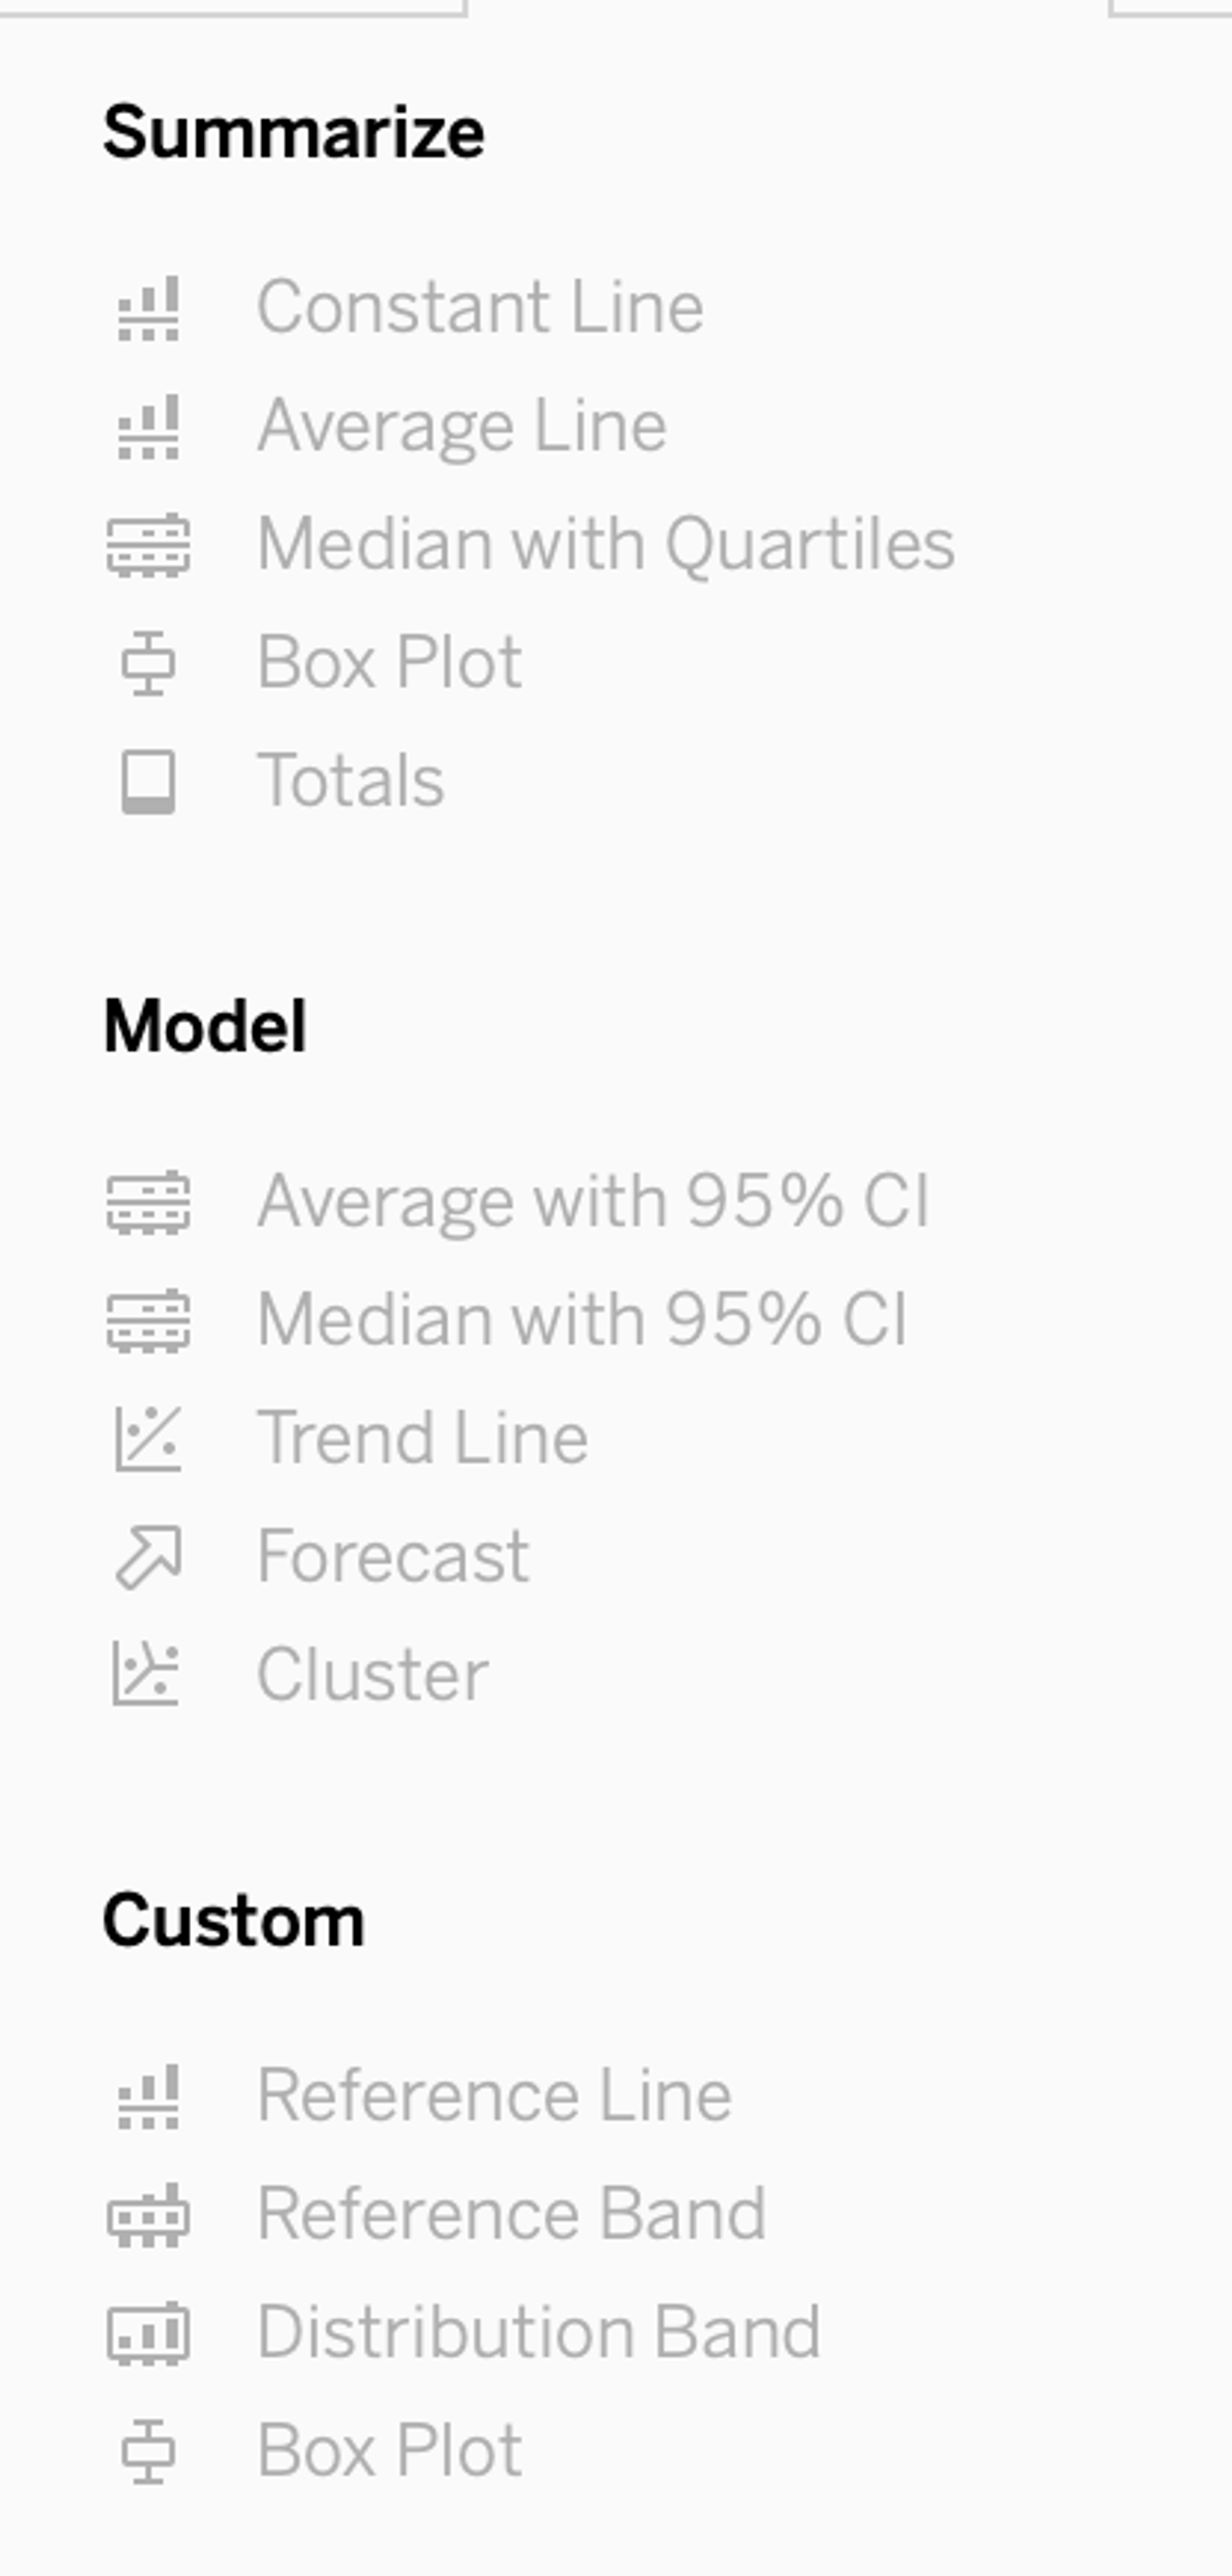
7. A reference line can be added from the Analytics Pane
- 참조선 (reference line)은 Analytics Pane에서 추가할 수 있음
8. ✅ When you connect to a new data source, all worksheets that previously referred to the original data source now refer to the new data source. If the new data source does not have the same field names as the original workbook, the fields are marked with an exclamation point . Which feature helps us fix this issue?
→ Replace Reference
- 새 데이터 원본에 연결하면 이전 데이터 원본을 참조했던 모든 워크시트가 새 데이터 원본을 참조한다. 새 데이터 원본의 필드 이름이 원본 워크북과 동일하지 않으면 필드에 느낌표가 표시된다.
이 문제를 해결하는 기능은 ‘Replace Reference (참조 바꾸기)’이다.

9. When using a Blend, what is the color of tick-mark on the primary and secondary data sources respectively?
- primary : Blue
- secondary : Orange

10. Which of the following returns the Absolute Value of a given number?
→ ABS(Number)
11. To use a quick table calculation, which of the following programming languages do you need to know?
→ None of these
- 퀵 테이블 계산을 사용하기 위해 어떠한 프로그래밍 언어를 몰라도 됨
12. LEFT JOIN returns all rows from the left table, with the matching rows in the right table
13. ✅ Which of the following are valid use-cases for the 'Manage Metadata' functionality?
- Manage Metadata (데이터 원본에서 볼 수 있음)
- To see the field name in the original data source
- To see the table a field belongs to
- To view all hidden fields

14. ✅ Which of the following are True for Measure Names?
- When working with a text table showing Profit for each Category, when you add Sales to the text table (by dragging it and dropping it in the view), the measure names field is automatically dragged to the row and filter shelves.
- It contains the names of all measures in your data, collected into a single field with discrete values.
- When you add it to a view, all of the measure names appears as row or column headers in the view.
- measure name : 불연속형
- measure value : 연속형
15. What does the box in a box plot represent?
→ The interquartile range (사분위 범위)

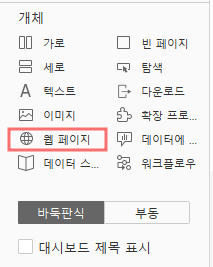
16. Is it possible to deploy a URL action on a dashboard object to open a Web Page `within` a dashboard rather than opening the system’s web browser?
→ Yes, we can do this with the help of a Web-Page object
- 대시보드 내에서 웹 페이지 열기 : 대시보드 > 개체 > 웹 페이지
17. Which of the following is the correct way to calculate Profit Ratio in Tableau?
→ SUM(Profit) / SUM(Sales)
- SUM([Profit]) / SUM([Sales]) vs SUM([Profit] / [Sales])
- 2가지의 결과 값은 다르게 나온다.
- SUM([Profit]) / SUM([Sales]) 은 모든행의 Profit 합계, Sales 합계를 구한 다음 나눔
- 반면 SUM([Profit] / [Sales])은 모든 행의 [Profit] / [Sales]를 구한 다음 집계함
- 우리가 원하는 것은 첫번째와 같은 계산식!
🔎 참고
[스타터스 TIL] 31일차.태블로 실전 트레이닝 (7) - 날짜 필터링, ATTR
1. 자주 나오는 질문 1.1 퀵테이블은 꼭 나쁜 것일까? - 데이터가 모두 VLOD에 나열되어 있는 경우, 그 시트가 그대로 대시보드에 보여지는 경우는 퀵테이블 사용을 권함 - 텍스트 테이블에 하나의
ars420.tistory.com

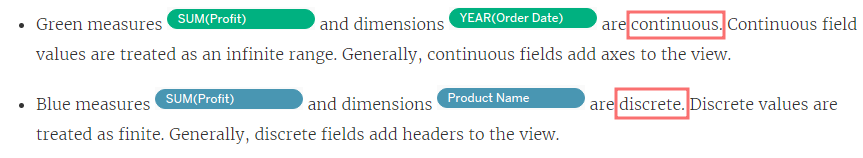
18. What does it imply if a field has a blue background?
→ It is discrete (불연속형)
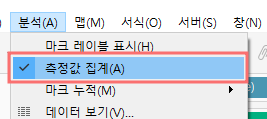
19. We can disaggregate the data, to see all of the marks in the view at the most detailed level of granularity
- 데이터를 세분화하여 보기의 모든 표시를 가장 세부적인 수준으로 볼 수 있다.
- Analysis > Aggregate Measures (분석 > 측정값 집계)
20. ✅ For creating variable sized bins we use Calculated Fields
- 계산된 필드를 활용하여 다양한 크기의 Bins를 만들 수 있다.
21. A Tableau Support case can be opened in which of the following validways?
→ Using the support option on the Tableau website
- Tableau Support와 관련된 내용을 보기 위해서는 태블로 웹사이트의 Support 옵션을 사용하면 된다.
22. ✅ We can use Tableau Reader as a static tool to open and interact with packaged workbooks with extracted data sources that have been created in Tableau Desktop.
- Tableau Reader를 static tool로 사용하여 Tableau Desktop에서 생성되고 추출된 데이터 소스로 패키지화된 워크북을 열고 상호 작용할 수 있다.
- Tableau Reader
- 남이 만들어 놓은 것을 실제 프로그램 실행 없이 그냥 보기만 할 수 있는 툴
- 작동할 수는 없음
23. You can use the Data interpreter in Tableau to clean / organise your data.
- Data interpreter
- titles, notes, footers, empty cells 등과 같은 것은 제외하고 데이터 세트의 실제 필드와 값을 식별한다.
- 다른 데이터와 독립적으로 데이터의 하위 집합을 사용하여 작업할 수 있도록 추가 테이블과 하위 테이블도 탐지한다.
- 이렇게 탐지한 후 원하는 데이터를 캡쳐하고 올바르게 식별했는지 확인할 수 있다.
24. Given a map, which of the following fields can be placed on Size,Shape,Detail,Color
→ Sales, State, Country, Profit
| Size | Sales | measure이기에 size 가능 |
| Shape | State | 다양한 주를 각기 다른 모양으로 가능 |
| Detail | Country | drill down, level 변경이 가능하기에 |
| Color | Profit | 가능 |
25. ✅ Which of the following points are True about Viz Animations?
- It is possible to turn them on for the entire workbook at once
- They can be turned on for certain worksheets only
- Sequential animations take more time but make complex changes clearer by presenting them step-by-step
✔ 동시 애니메이션 (Simultaneous animations)
- 기본 동시 애니메이션은 속도가 빠르며 단순한 차트 및 대시보드에 값 변화를 표시할 때 잘 작동한다.
✔ 순차적 애니메이션 (Sequential animations)
- 순차적 애니메이션에는 더 많은 시간이 걸리지만 복잡한 변화를 단계별로 표시하여 더 명확하게 만든다.
- 서식 > 애니메이션
- 애니메이션 사용 불가 : Maps, polygons, density marks in browsers
26. Enabling any other type of sort (Field, alphabetic, or Nested) clears the manual sort we create.
다른 유형의 정렬 (필드, 알파벳, 중첩)을 사용하면 설정한 수동 정렬은 지워진다.
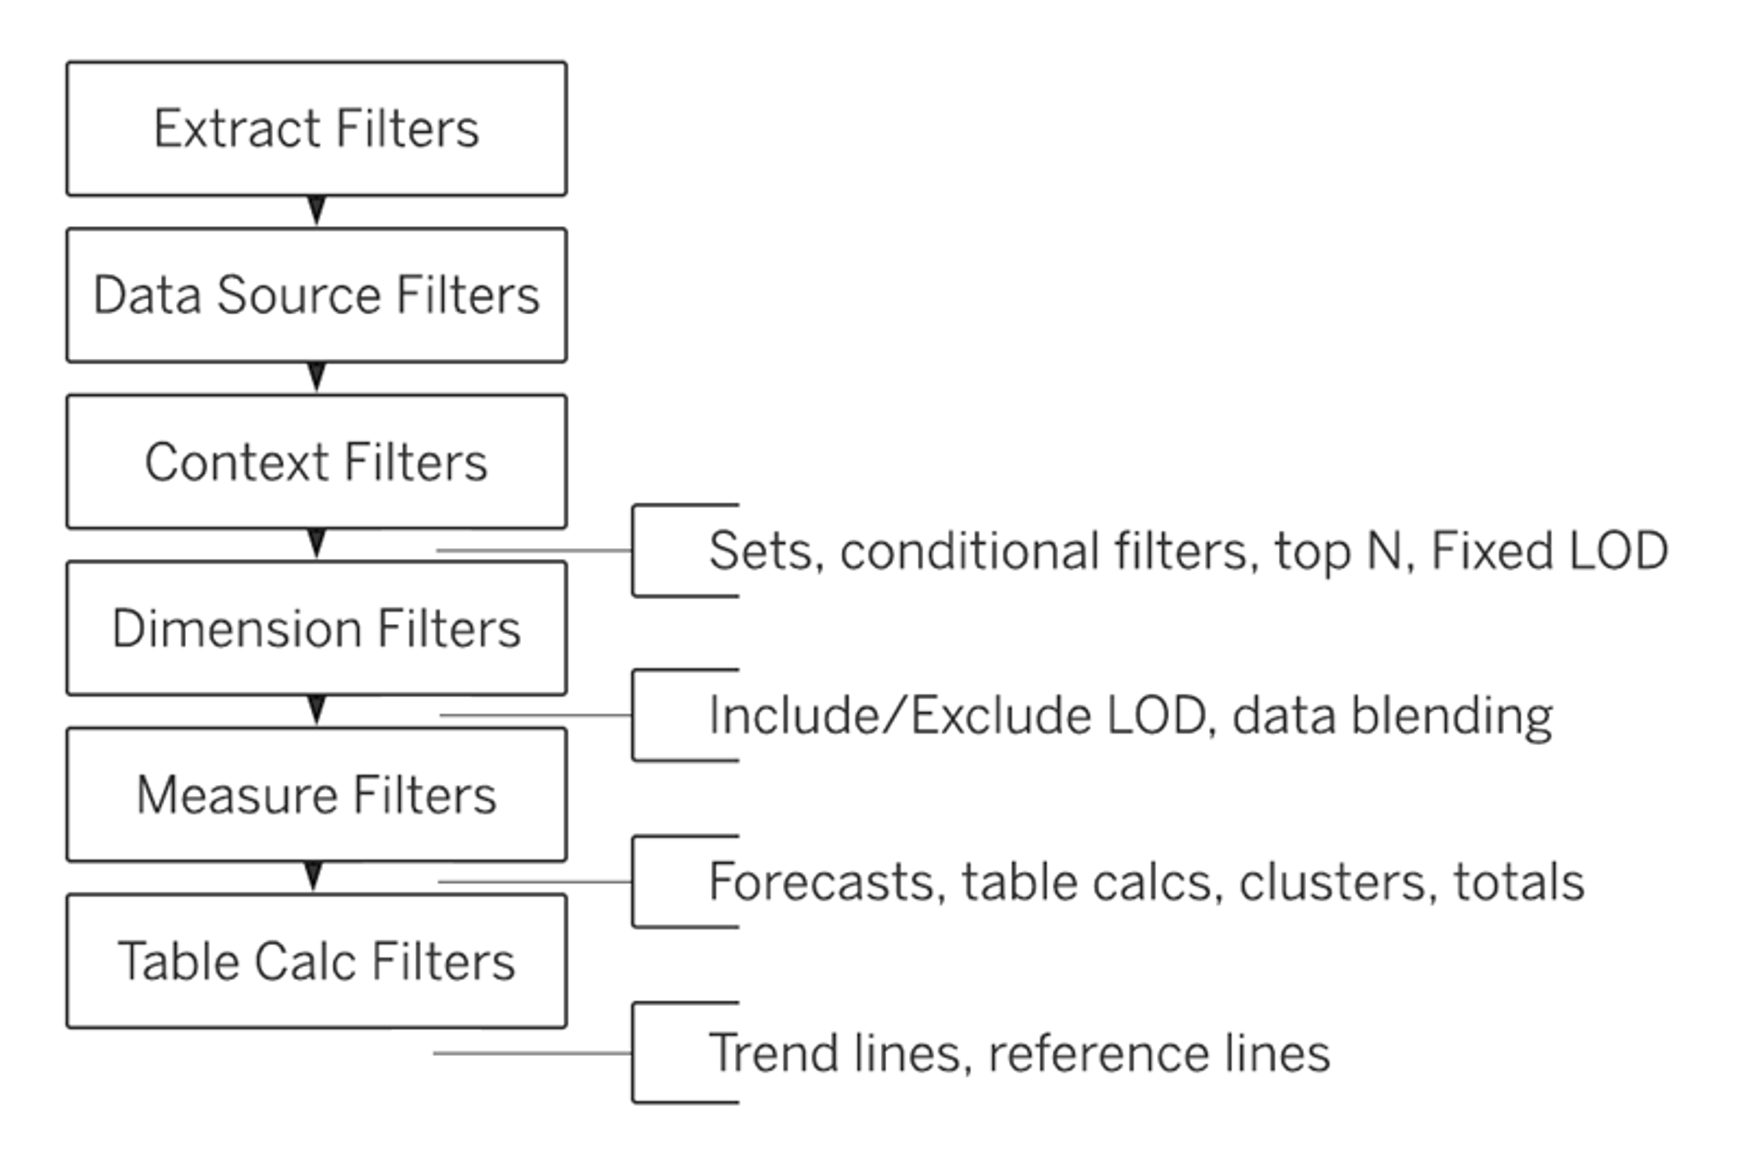
27. Context Filters are executed after Data Source filters
28. The calculation [Ship Date] - [Order Date] will return Number of days between these dates
- 2개의 날짜를 뺄셈하면 날짜 별 차이에 따른 일이 나온다.
29. What is this entire view referred to as in Tableau? → Analytics Pane
30. A field that shows average home values for the European Union in 2016 is most likely :
→ **An aggregated measure**
- 문제 속 Average라는 것을 통해 측정값 집계를 나타낸다는 것을 알 수 있다.
31. How do you identify a continuous field in Tableau?
→ It is identified by a green pill in a visualization
32. Which of the following charts types always includes bars sorted in descending order?
→ Pareto Chart
- Pareto Chart (파레토 차트)는 내림차순으로 설정되며, 막대와 선 그래프 모두를 포함한다. 막대는 내림차순이고 선은 오름차순이다.
33. ✅ Which of the following are interactive elements that can be added to a dashboard for users?
- Filter Action
- URL Action
- Highlight Action
34. Tableau Data Extract (.tde) is a snapshot of the data that Tableau stores locally. Good for very large datasets of which we only need few fields.
- Tableau Data Extract (.tde)
- hyper = .TDE 같은 의미임. 오프라인에서 데이터를 공유하는 데 유용함
- Extracts의 이점
- Supports large data sets
- Fast to create
- Help improve performance
- Support additional functionality
- Provide offline access to your data
35. How can you MANUALLY assign geographic roles to a dimension from the data pane?
→ Right click the dimension > Geographic role > assign the appropriate geographic role
36. To concatenate fields, they must be of same data type
- 필드를 concat할 때, 반드시 같은 데이터 유형이어야 한다.
- concat을 하면서 특정 데이터의 유형을 변경할 수 있다.

37. ✅ Which of the following are the options to export the data used to build the view / visualisations?
- MS Access Database (→ 윈도우)
- CSV file (→ 맥)
- 워크시트 > 내보내기 > 데이터 > 저장을 하면 CSV file(mac), MS Access Database (윈도우)로 저장됨
38. The icon associated with the field that has been grouped is a Paper Clip

39. A LEFT JOIN or INNER JOIN creates a row each time the join criteria is satisfied, which can result in duplicate rows. One way to avoid this is to use relationships instead.
✔ JOIN
- 테이블의 세부 수준이 다를 경우, 데이터가 손실되거나 중복될 수 있음
✔ Realationship
- 모든 데이터를 보존하며 중요한 데이터는 손실되지 않는다.
- 중복된 데이터를 만들지 않음

→ 성능 옵션을 활용하면 중복과 같이 관계로 맺어진 데이터의 성능을 최적화할 수 있음
43. A sheet can be used within a story directly. Either sheets should be used within a dashboard, or a dashboard should be used within a story.
- story는 순서대로 배열된 시트의 모음
- story의 각 개별 시트를 story point라고 함
44. For a relative date filter, the default anchor is Today’s date
- Relative date filter를 사용하면 항상 최신 데이터를 표시하는 보기를 만들 수 있다.

45. Which data type in Tableau does this icon represent? → Boolean


2. Test 5
1. ✅ When you drag additional tables to the logical layer canvas, Tableau automatically attempts to create the relationship based on existing key constraints and matching fields to define the relationship. If it can't determine the matching fields, then relating these tables is not possible. (X)
추가 테이블을 논리 계층 캔버스로 끌면 Tableau는 기존 키 제약 조건과 일치하는 필드를 기반으로 관계를 자동으로 생성하여 관계를 정의합니다. 일치하는 필드를 확인할 수 없는 경우 이러한 테이블을 연관시킬 수 없습니다.
→ 검색된 제약조건이 없으면 다대다 관계가 생성되고 참조 무결성이 일부 레코드 일치로 설정된다.
이러한 기본 설정은 안전한 선택이며, 데이터 소스에 가장 큰 유연성을 제공한다.
2. When relating tables, the fields that define the relationships must have the same data type.
→ 테이블끼리 관계를 맺을 때, 관계로 정의하는 필드는 반드시 같은 데이터 유형이여야 한다.
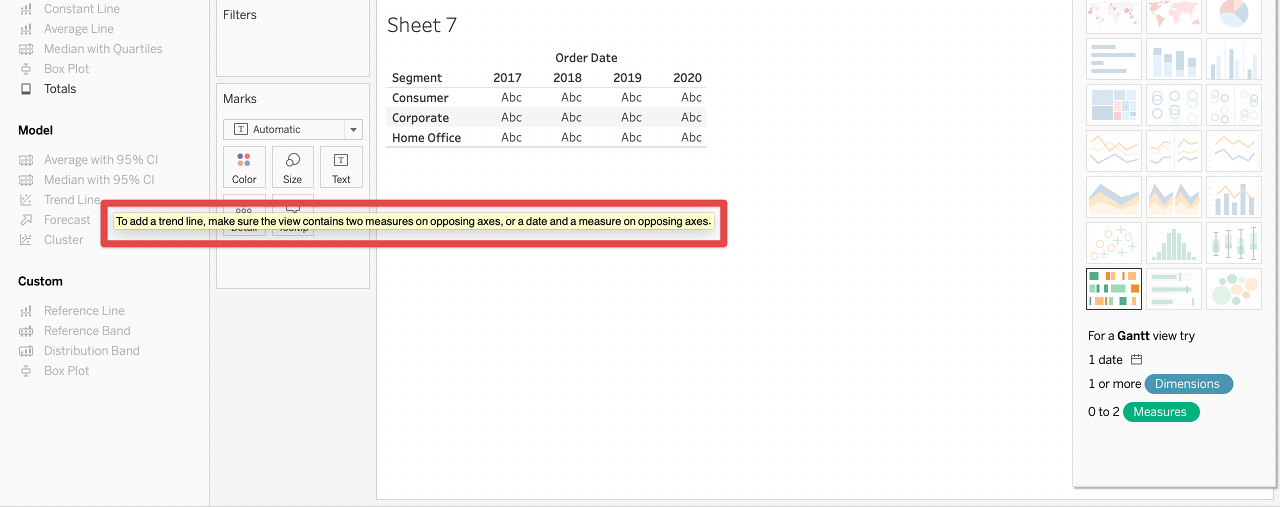
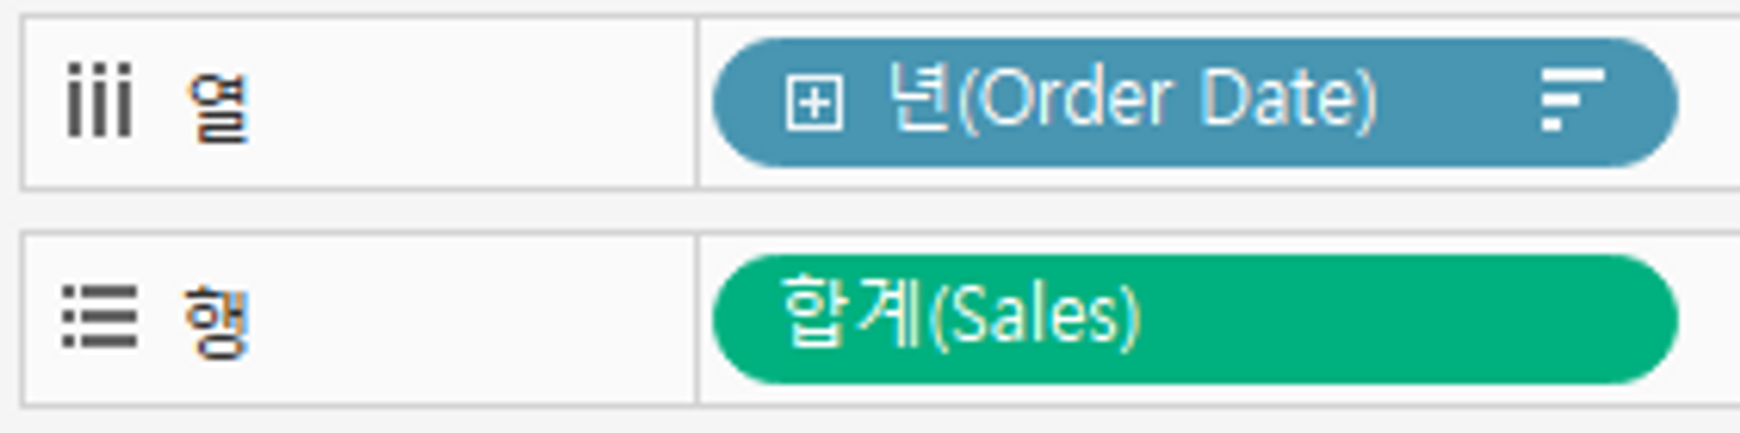
3. ✅ Which of the following are required to create a trend line?
→ 2 measures on opposing axes, or a date and a measure on opposing axes.
✔ 추세선 만들 수 있는 상황
- 2개의 측정값이 각 반대의 축에 있어야 함
- 날짜와 측정값이 각 반대의 축에 있어야 함
4. ✅ Which of the following are FALSE about Joins?
✔ 조인 (Join)
- May drop unmatched measure values (일치하지 않는 측정값이 제외될 수 있음)
- They are displayed with Venn diagram icons between physical tables (물리적 테이블 사이에 벤다이어그램 아이콘으로 표시됨)
- They are a more dynamic way than relationships to combine data (X)
→ static way (정적인 방법)
- Joins can be defined at the time of query dynamically (X)
→ 동적으로 정의할 수 없음!
- Joined tables are never merged into a single table (X)
→ 조인된 테이블은 항상 단일 테이블로 병합된다
| Join의 특징 | |
| 1 | Are displayed with Venn diagram icons between physical tables |
| 2 | Require you to select join types and join clauses |
| 3 | Joined physical tables are merged into a single logical table with a fixed combination of data |
| 4 | May drop unmatched measure values |
| 5 | May duplicate aggregate values when fields are at different levels of detail |
| 6 | Support scenarios that require a single table of data, such as extract filters and aggregation |
5. When working with Excel, text file data, JSON file, .pdf file data, you can use Wildcard Search to union files across folders, and worksheets across workbooks. Search is scoped to the selected connection.

6. The row and column shelves contain Pills.
→ 아래의 초록색, 파란색 아이콘이 알약과 비슷하기에 pill이라고 함
7. You can create aliases for members in a dimension so that their labels appear differently in the view.


→ 차원 (dimension) 내의 데이터 라벨을 alias를 활용하여 변경할 수 있다.
8. Tableau Packaged Workbook (.twbx) contains the visualisations, info needed to build the visualisations, and a copy of the data source.
✔ twbx 파일에 포함되어 있는 파일
- Background images
- Custom geocoding
- Custom shapes
- Local cube files
- Microsoft Access files
- Microsoft Excel files
- Tableau extract files (.hyper or .tde)
- Text files (.csv, .txt, etc.)
9. What term is used to describe the following picture? → Hierarchy (계층)

10. Tableau Public is hosted by Tableau to share our visualisations publically with the world.
▼ 태블로 퍼블릭 ▼
Discover
Explore stunning data visualizations and the talented community that creates them on Tableau Public.
public.tableau.com
11. Which of the following are valid options to define the scope of a reference line? Choose 3.
→ Table, Pane, Cell

12. What will the following function return?
LEFT("Tableau", 3) → Tab
13. What is this view referred to as in Tableau? → Data Pane

14. Which of the following 2 fields CANNOT be deleted in Tableau?
→ Measure Values, Measure Names
Measure Values, Measure Names은 자동으로 생성된 것으로 삭제할 수 없다.
반면, Calculated Fields와 Number of Records는 삭제할 수 있다.
15. You can union your data to combine two or more tables by appending values (rows) from one table to another.
✔ 유니온 (Union)
- 동일한 수의 열(Rows)을 가져야 한다.
- 항상 새 테이블(table)을 만들어낸다.
- 서로 다른 데이터 원본(Data source)의 데이터를 통합할 수 없다(출신을 따진다)
- 데이터 소스를 식별을 도와주는 참조 필드(reference fields)를 생성한다
- 수동 및 와일드카드 탐색으로 수행될 수 있다.
- 유니온(Union)된 테이블은 조인을 만드는데 사용될 수 있다.
💡 회고
오늘도 하루종일 태블로 자격증 준비를 했다.
문제를 계속 푸니까 조금씩 이해가 되는 중인데 아직은 좀 더 공부를 해야 할 듯 싶다.
이번주 주말에 시험을 치는 것이 목표인데 가능할지 조금의 의문은 있지만! 그래도 해보려고 노력해야쥐~!!!!!
아좌좌~~~~~~💪💪😎
'웅진X유데미 STARTERS > TIL (Today I Learned)' 카테고리의 다른 글
| [스타터스 TIL] 45일차.SQL 실전 트레이닝 (1) - 데이터 분석, 테이블파악 (0) | 2023.04.10 |
|---|---|
| [스타터스 TIL] 44일차.태블로 실전 트레이닝 (20) - 태블로 자격증 공부 (Test 1, Test 2) (1) | 2023.04.08 |
| [스타터스 TIL] 42일차.태블로 실전 트레이닝 (18) - 태블로 자격증 공부 (Test 3) (0) | 2023.04.05 |
| [스타터스 TIL] 41일차.태블로 실전 트레이닝 (17) - 팀 프로젝트 발표, 태블로 자격증 공부 (0) | 2023.04.04 |
| [스타터스 TIL] 40일차.태블로 실전 트레이닝 (16) - 팀 프로젝트 (1) | 2023.04.04 |